Sea Level Rise
As Sea Levels rise, tiny Pacific Islands might not sink, they might just move instead

What is Sea Level Rise?
What is driving sea level rise?

Ocean thermal expansion
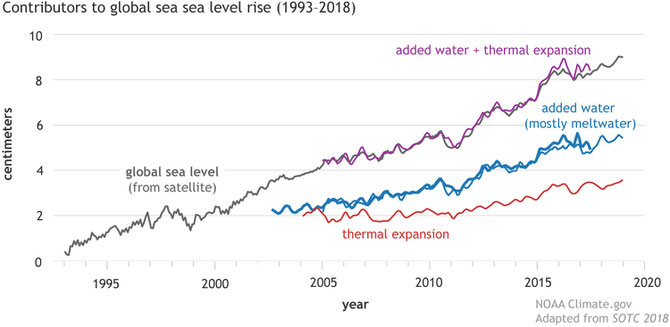
As greenhouse gases from fossil fuel use and other human activities accumulate in the atmosphere, they trap energy that would otherwise escape into space. That energy causes average global surface temperatures to rise, especially the upper layers of the ocean. Thermal expansion happens when the ocean heats up. The heat causes sea water molecules to move slightly farther apart, taking up more space. The result is the ocean rises higher, flooding more land. Over the past several decades, about 40% of global sea level rise has been due to the effect of thermal expansion. The ocean, which covers about two-thirds of the Earth’s surface, has been absorbing and storing more than 90% of the excess heat added to the climate system due to greenhouse gas emissions.
Melting land ice
The other major factor in rising sea levels is melting land ice. Mountain glaciers and polar ice sheets are diminishing at rates faster than natural systems can replace them. When land ice melts, that meltwater eventually flows into the ocean, adding new quantities of water to the ocean and increasing the total ocean mass. About 50% of global sea level rise was induced by land ice melt during the past several decades.
Currently, the polar ice sheets in Greenland and Antarctica hold enough frozen waters that if they melted completely, it would raise the global sea level by up to 200 feet, or 60-70 meters – about the height of the Statue of Liberty. Climate change is melting sea ice as well. However, because this ice already floats at the ocean’s surface and displaces a certain amount of liquid water below, this melting does not contribute to sea level rise.
Global Sea Level Rise
The rate that sea level is changing is called the trend in sea level. The sea level trend is presented as the height of change per year for example as mm per year.
The amount of sea level rise has been determined globally from long term tide gauge records. Globally, sea level rise has been reported at an average rate of 1.8 mm per year for the past century and 1.9 mm/year from 1961 up to 2009.
Since 1993, measurements from satellite radar altimeters have allowed estimates of global mean sea level. These measurements are continuously calibrated
against a network of tide gauges. When seasonal and other variations are subtracted, they allow estimation of the global sea level trend.
The global sea level trend from the beginning of satellite measurements in 1993 up to 2014 is 3.2 mm/year. The sea level trend for the period 1993 to 2009 calculated from tide gauge records is 2.8 mm/year very close to the satellite altimeter global sea level trend.
Sea Level rise in coastal Australia
In Australia, the trend in sea level has been calculated from long term averaged tide gauge records and satellite altimetry:
1900 to 2011 sea level trend = 1.2 mm/year
1966 to 2011 sea level trend = 1.7 mm/year
1993 to 2011 sea level trend = 4.6 mm/year
The two longest tide gauge records at Fort Denison in Sydney Harbour and at Fremantle in Western Australia indicate a sea level trend of 0.73 mm/yr at Fort Denison and a trend of 1.78 mm/yr at Fremantle. Both of these Australian determinations may include changes in the reference datum relative to the International Frame (IRF) due to the vertical movement of land.
Resources:
Global sea level rise from:
Douglas, B.C., 1997. Global sea level rise: A redetermination. Surveys of Geophysics 18:279-292
Australian sea level rise from:
Reed J. Burgette, Christopher S. Watson, John A. Church, Neil J. White, Paul Tregoning,Richard Coleman. Characterizing and minimizing the effects of noise in tide gauge time series: relative and geocentric sea level rise around Australia. Geophysical Journal International, Volume 194, Issue 2, August, 2013, Pages 719–736,https://doi.org/10.1093/gji/ggt131
Satllelite altimetry mean sea levels from University of Colarado CU sea level research group:
http://sealevel.colorado.edu/content/tide-gauge-sea-level and http://sealevel.colorado.edu/
Pacific Island Sea level rise article from: http://www.fastcoexist.com/3038013/as-sea-levels-rise-tiny-pacific-islands-might-not-sink-they-might-just-move-instead

 Marine Science Australia

